Market Basket Analysis in Python - Part 2
- Claire Matuka
- Mar 3, 2022
- 5 min read
Updated: Mar 10, 2022
Let me just start by saying that finding real data is not easy. Even if you do, the data has already been analyzed and used by all the data analysts and data scientists in the world. As I was trying to figure out what data to use for this market basket analysis tutorial, I found that there were around two main datasets that exist:
I will not be using these, because I actually want to have fun with this tutorial. In as much as I appreciate groceries, I high-key get more excited about fashion.
I generated some random data for SHEIN, which is an online apparel store or boutique. The weather in Nairobi is currently very sunny and so I am particularly interested in gathering insights on graphic t-shirts (graphic tees). They are a must-have in this kind of weather.
This tutorial involves the following steps:
1. Generate Random dataset
To generate the random dataset, I gathered a list of 25 items that are currently on the SHEIN website. Also, interesting fact, as of 2019, the SHEIN website had listed over 2 million products. So my dataset is barely scratching the surface on what is available.
Normally, transaction data will include several variables such as "Invoice Number", "Price", "Items", "Item code", etc. such as below (this is actually the online retail UK data mentioned above):

In order to use the apriori algorithm, it is necessary to encode the data such that each row represents a transaction, and each column represents an item. This way it is clear which items were bought and not bought for each transaction.
Because this tutorial is mainly focused on Market Basket Analysis, and not data generation or data transformation, I simply generated the encoded data. I generated a Bernoulli matrix with 2000 rows and 25 columns, with the probability of an item being bought as 0.1. This means that P(X=1) = 0.1 while P(X=0) = 0.9
# creating a matrix of ones and zeros
shein_matrix = np.random.binomial(size=(2000,25), n=1, p= 0.1)

#columns
the_columns = ["Car & Slogan Graphic Drop Shoulder Tee",
              "Letter Graphic Drop Shoulder Longline Tee",
              "Drop Shoulder Letter & Eagle Print Tee",
              "Slogan Graphic Drop Shoulder Tee",
              "Mountain And Letter Graphic Tee",
              "Heart & Letter Graphic Tee",
              "DAZY Figure & Slogan Graphic Tee",
              "Letter & Rocket Print Tee",
              "Tie Dye Drop Shoulder Oversized Tee",
              "Letter Graphic Crew Neck Tee",
              "Figure Graphic Round Neck Tee",
              "Butterfly Print Round Neck Tee",
              "Letter and Car Print Top",
              "Planet Print Drop Shoulder Tee",
              "Heart And Wing Rhinestone Crop Top",
              "DAZY Letter Graphic Tee",
              "Two Tone Slogan Graphic Longline Tee",
              "Letter & Cup Print Tee",
              "Letter & Tape Print Tee","Honey Graphic Tie Dye Top",
              "Color Block Letter Graphic Tee",
              "Cartoon & Graphic Print Tee",
              "Rhinestone Letter Crop Tee",
              "California Graphic Short Sleeve Tee",
              "Moon & Mushroom Print Tee"]

#index
the_index = list(range(100001,102001))

#creating a dataframe
shein_df = pd.DataFrame(shein_matrix, index=the_index, columns=the_columns)
shein_df.index.name = "Invoice No"
shein_df
The resulting data was:

If you would also like to have fun with this data and replicate my exact results, find it here:
2. Use Apriori algorithm to get frequent item sets
The perks of using python is that there is a library for literally anything you may want to do. For association rules, we will use the mlxtend library. Make sure to install it using the command:
pip install mlxtendIn the previous article, we mentioned Support which basically measures how frequently an itemset appears in the dataset.

For this tutorial:
I chose to focus on the association between two items although it is possible to have an association that involves more than two items. Your code may take slightly longer to run if you choose to try and get the association between several items.
I also selected a minimum support of 0.01. You are free to select any value depending on what you consider as frequent. For me, I was simply interested in items that appeared in at least 1% of all transactions. This is around 20 transactions out of the total 2000 transactions.
#importing packages
from mlxtend.frequent_patterns import apriori

#getting frequent itemsets using support and ordering them from highest to lowest support
freq_items = apriori(shein_df, min_support = 0.01, max_len = 2,
                     use_colnames=True).sort_values('support',
                     ascending = False). reset_index(drop = True)
freq_items
This resulted in the following list of item sets:
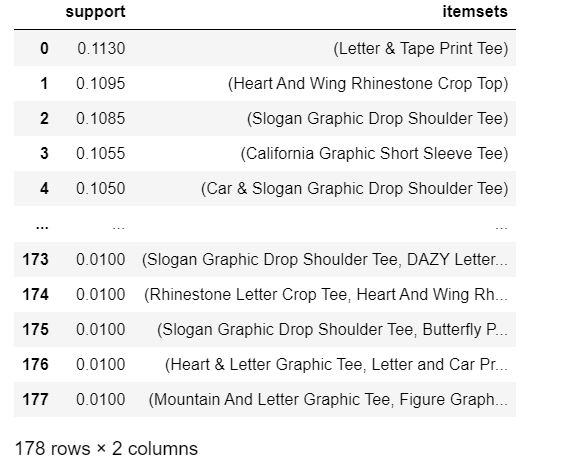
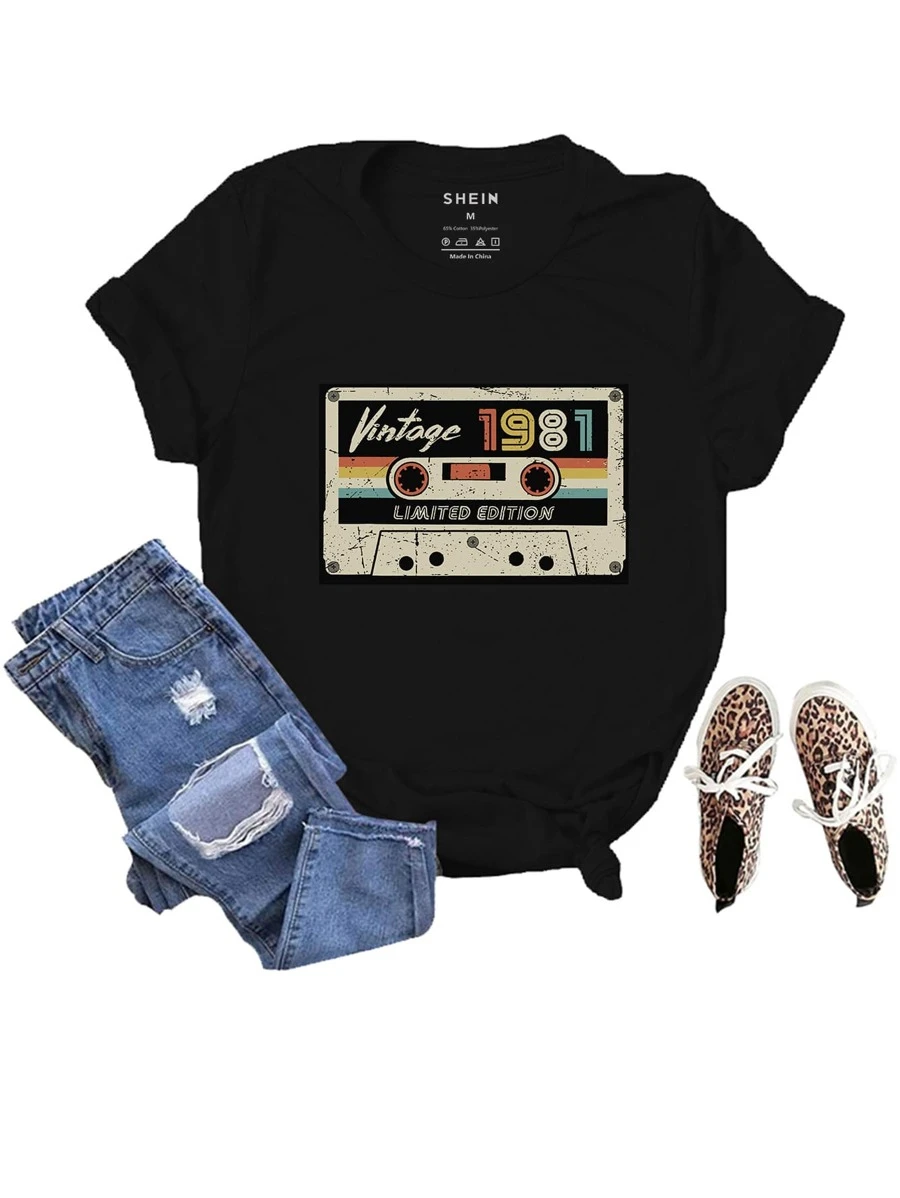
It is clear that the "Letter & Tape Print Tee" is the most frequently purchased item as it was purchased in 11.3% of all the transactions.
Here is a cute visual of the t-shirt as obtained from the SHEIN website.
3. Create association rules
Other than Support, we also mentioned two other metrics: Confidence and Lift.
Confidence measures the percentage of all transactions satisfying X that also satisfy Y

Lift measures the ratio of the observed support to that expected if X and Y were independent. If Lift>1, it means that the item sets occur a lot more often than expected if they were independent. A higher lift value indicates a higher association between the items.

To generate the association rules, we still use the mlxtend library.
#importing packages
from mlxtend.frequent_patterns import association_rules

# computing all association rules and ordering them from highest to lowest lift value
the_rules = association_rules(freq_items, metric ='lift', min_threshold = 1).sort_values('lift', ascending = False). reset_index(drop = True)
the_rules

For this particular tutorial, I am keen on just the top 2 item sets with the highest association. You are however free to focus on any number of associations.

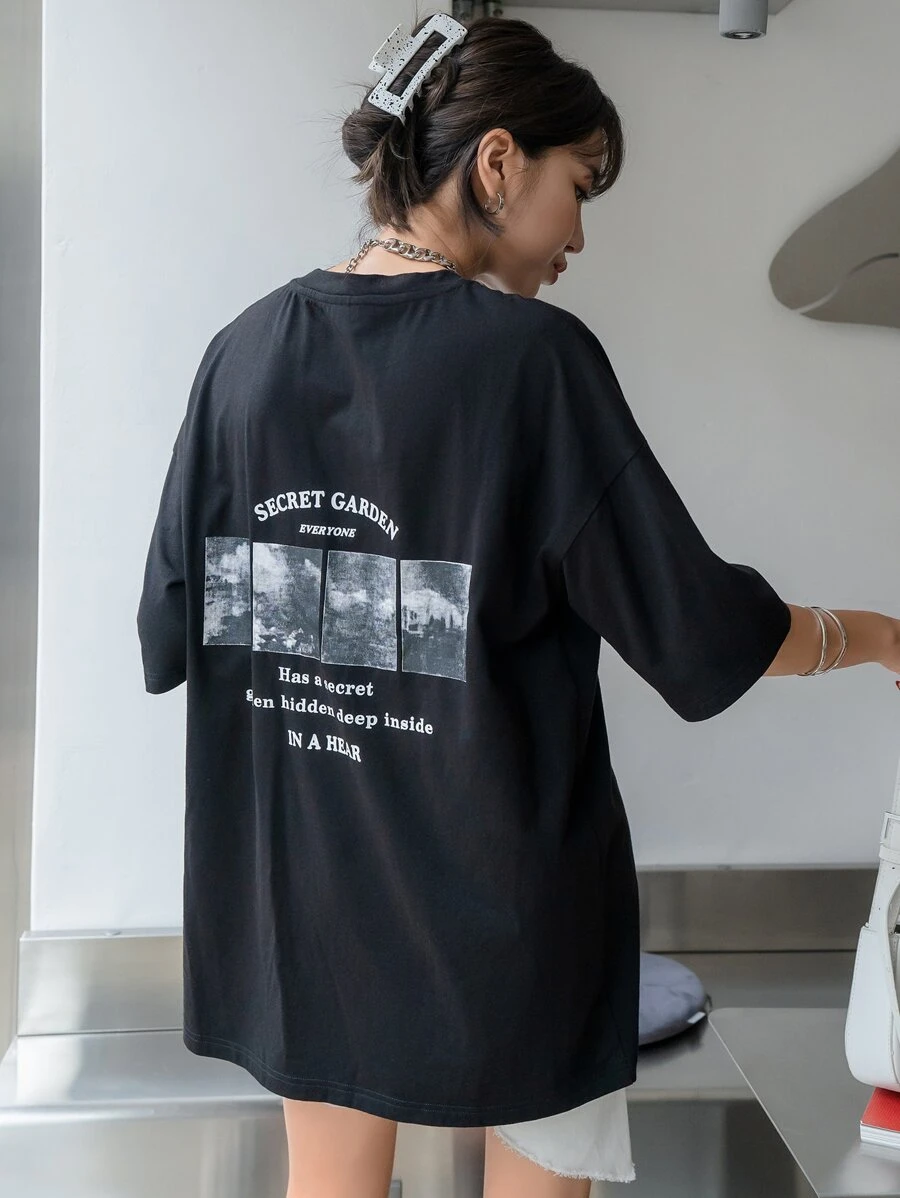
Images from shein.com
The "Rhinestone Letter Crop Tee" and "DAZY Letter Graphic Tee" have the highest lift and can therefore be said to be the most associated items. The confidence level for "Rhinestone Letter Crop Tee" ----> "DAZY Letter Graphic Tee" is 0.169591 which is greater than 0.145729, which is the confidence level for "DAZY Letter Graphic Tee"---> "Rhinestone Letter Crop Tee". We will therefore select the first rule that simply indicates that customers are more likely to buy the "DAZY Letter Graphic Tee" after purchasing the "Rhinestone Letter Crop Tee".
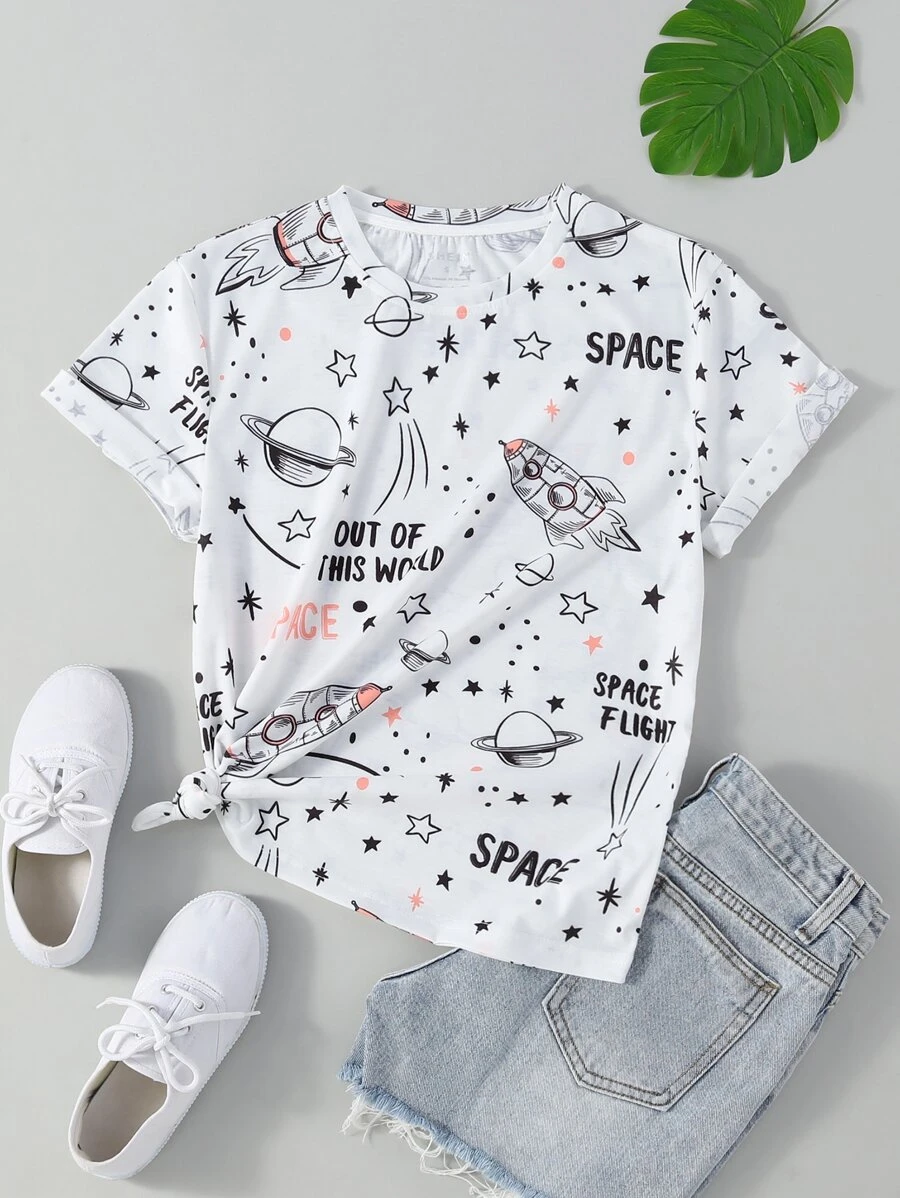
The "Letter and Rocket Print Tee" and "Rhinestone Letter Crop Tee" have the second highest lift and can therefore be said to be among the most associated items. The confidence level for "Letter and Rocket Print Tee"----> "Rhinestone Letter Crop Tee" is 0.142857 which is less than 0.161111, which is the confidence level for "Rhinestone Letter Crop Tee" ----> "Letter and Rocket Print Tee". We will therefore select the second rule that simply indicates that customers are more likely to buy the "Letter and Rocket Print Tee" after purchasing the "Rhinestone Letter Crop Tee".
Image from shein.com
4. Draw conclusions and recommendations
Based on the insights gathered, I would recommend that:
On the website, after a customer views, add to their cart, or purchases the "Rhinestone Letter Crop Tee", they should get recommended the "DAZY Letter Graphic Tee" and "Letter and Rocket Print Tee".
Two new products that are actually product bundles could be added to the website, at a discounted price.
**************
Hope you enjoyed this tutorial. Which graphic tee do you like the most?
Disclaimer:
Just incase you missed it, none of this data is actually real. It was just generated for the purpose of this tutorial. I have no access to information on SHEIN transactions.


Comments